Updated:
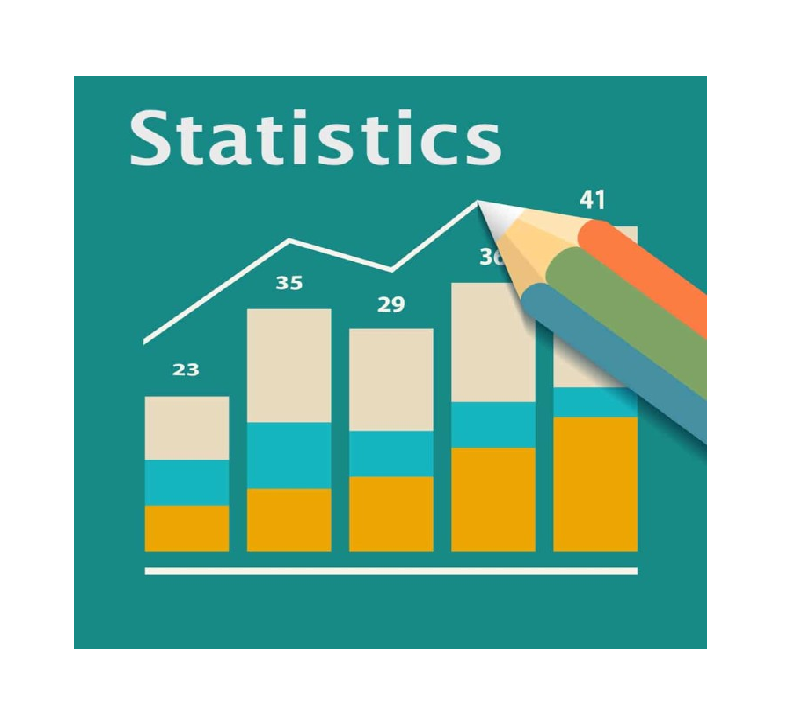
Mathematics: Statistics
Statistics is the branch of mathematics that deals with the collection, organization, presentation, analysis, and interpretation of data. Data can be represented in the form of tables, bar graphs, histograms, and frequency polygons. The main measures used in statistics are mean, median, and mode, which help in understanding the central tendency of data.
What you get in every chapter:
1. Brush Up: A quick video to connect previous knowledge to the new topic.
2. Syllabus: A clear breakdown of what you need to study (and what you can skip).
3. Real-Life Application: Why does this chapter matter? We show you the practical side.
4. Questions & Answers Paper: We solve Questions & Answers so you are exam-ready.
5. Mind Maps: Downloadable one-page summaries to revise the whole chapter in 5 minutes.
6. Quiz: Test yourself immediately to ensure you understood the concept.
Course Goal: To help you score 95+ in your Board Exams by simplifying complex concepts into easy-to-remember stories and logic.
Similar Courses
Level
Language